Features preprocess:
After exploring the data I realized there were multiple ways of preprocessing features, and the right choice depended heavily on the end goal at hand.
From a machine learning lens to predict churn, I needed a robust model as baseline was already 85%. While logistic regression does not do well with non linear,
non monotonic data, it does provide a great deal of useful information with its coefficients that could be used directly to make impactful marketing decisions.
For this case I used a one hot encoder for the four discrete features. I also scaled the numerical features and filled in the 0.7% missing values with the mean
of each feature.
My second model provided improved predictions, but required a different preprocessing approach. With that in mind and having a relatively small data sample, I considered cross validation as its predictions often provide a reliable generalization, but does lose a large portion of potential testing data. I decided to do a three way split train/val/test to keep my test set for the final test at the end of model optimization and selection, while my val data will be used multiple times for model interpretation. I decided to preprocess the categorial features for my second model with an ordinal encoder (it does better with the tree based model (boosting and bagging)). I filled in missing values with the median of each feature as I could not afford to reduce the sample size further by dismissing the rows with missing values in hope of getting a better trained model.
Predicting churn requires a balance between recall and precision.
Relevant features:
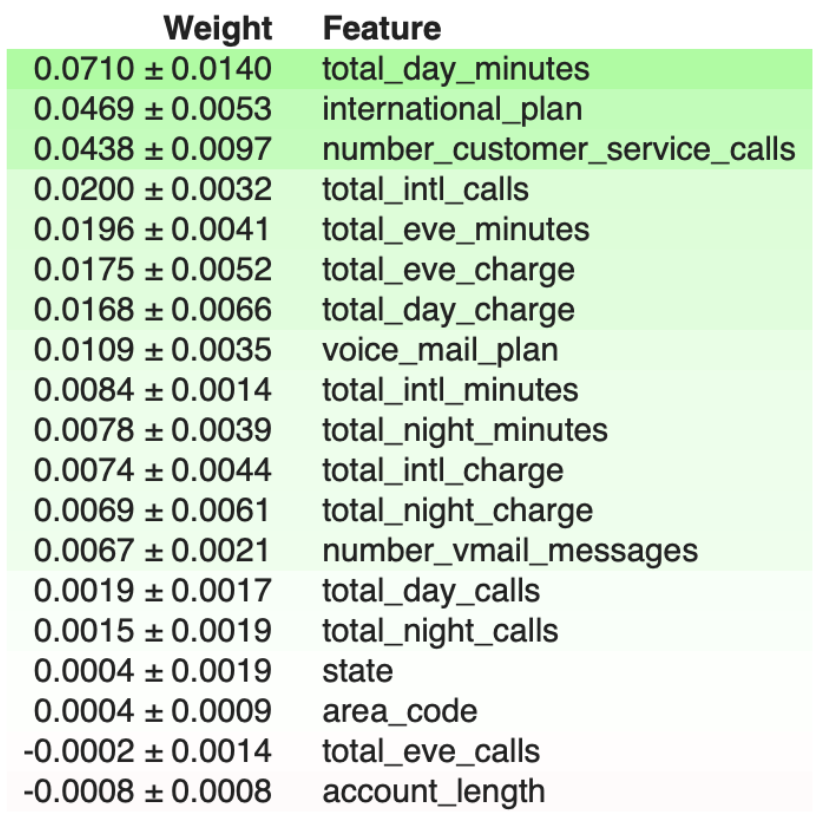
Scikit learn random-forest feature importances tend to inflate the importance
of continuous or high cardinality categorical variables according to Jeremy Howard. In order to have a higher confidence level,
I ran an xgboost permutation importances shuffling different features content and rescoring the accuracy with one feature shuffled.
I used Eli5 library to plot this list of important features ranked from top to bottom.

Metrics:
For model validation and interpretation I used accuracy. For tuning and understanding more about improving the model for the problem I used recall and precision.
My three way split allowed me to test the data I retained for a final test on the model to measure how it generalized on unseen data.
The confusion matrix was helpful but recall, precision and threshold setting for the model decisions were key to deliver a balanced performance.
Below is my precision and recall along with my confusion matrix and how I balanced between bias and variance.
precision recall f1-score support
      no            0.97        0.98      0.98       431
     yes            0.87        0.76      0.81        59

accuracy                                    0.96       490    macro avg      0.92        0.87      0.89       490 weighted avg     0.96        0.96      0.96       490
The forces behind one prediction, kind of like coefficients but for trees.


The code: (step will be linked in my github) see code version here